Candlestick charts are a vital tool in forex trading. They provide traders with valuable insights into the market’s current state and help predict potential price movements. In this article, we will explore the basics of reading forex candlestick charts, understanding the anatomy of a candlestick, and how traders can use them to make informed decisions.
What Are Forex Candlestick Charts?
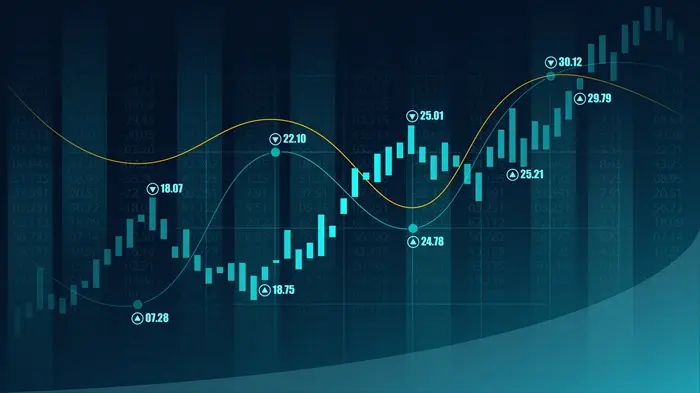
Forex candlestick charts are graphical representations of price movements over a specified period. Unlike traditional line charts, which only show the closing prices, candlestick charts display open, high, low, and close (OHLC) prices. This extra information helps traders understand the market sentiment and identify trends more effectively.
Each candlestick represents a specific time period, such as a minute, an hour, a day, or a week. The candlestick body and its shadows (or wicks) provide insights into market direction and momentum.
The Anatomy of a Candlestick
Understanding the structure of a candlestick is crucial for interpreting forex candlestick charts. Every candlestick consists of four main components:
Open: The price at which the asset opens during the time period.
Close: The price at which the asset closes during the time period.
High: The highest price reached during the time period.
Low: The lowest price reached during the time period.
The candlestick body is formed between the open and close prices, while the wicks (or shadows) represent the high and low prices. Depending on whether the close price is higher or lower than the open price, the candlestick can either be bullish or bearish.
Bullish Candlestick
A bullish candlestick occurs when the close price is higher than the open price. In this case, the candlestick body is typically filled with a lighter color, such as green or white, to indicate that the market closed higher than it opened.
Bearish Candlestick
A bearish candlestick occurs when the open price is higher than the close price. The candlestick body is often colored darker, such as red or black, to signify that the market closed lower than it opened.
Types of Candlesticks
There are different types of candlesticks, each carrying its own implications for market sentiment. Some of the most common candlestick patterns include:
Doji
A doji is a candlestick pattern where the open and close prices are nearly identical. This indicates indecision in the market and can be a sign of a potential reversal. Doji candlesticks are usually found at the end of trends and are considered a signal for traders to remain cautious.
Engulfing Patterns
An engulfing pattern consists of two candlesticks: one small and one large. A bullish engulfing pattern occurs when a small bearish candlestick is followed by a large bullish candlestick that completely engulfs the body of the previous one. This pattern suggests that buyers have taken control, and the market may trend upwards.
A bearish engulfing pattern is the opposite. A small bullish candlestick is followed by a large bearish candlestick that engulfs the previous candlestick. This pattern signals that sellers have taken control, and the market could trend downward.
Hammer and Hanging Man
Both the hammer and hanging man candlestick patterns have a similar appearance. They feature a small body near the top of the candlestick with a long lower wick. The hammer appears at the bottom of a downtrend and signals a potential reversal to the upside. The hanging man, however, appears at the top of an uptrend and signals a possible reversal to the downside.
Shooting Star
The shooting star pattern is a single candlestick with a small body near the bottom of the candlestick, a long upper wick, and little to no lower wick. It typically appears at the top of an uptrend and suggests that the market may reverse and move lower.
Morning Star and Evening Star
A morning star is a three-candlestick pattern that signals a potential reversal from a downtrend to an uptrend. It consists of a long bearish candlestick, a small-bodied candlestick (often a doji), and a large bullish candlestick. The evening star is the opposite and signals a reversal from an uptrend to a downtrend.
Understanding Candlestick Patterns in Forex Trading
Candlestick patterns are essential tools for forex traders as they help identify potential price reversals or continuations. By recognizing key candlestick patterns, traders can gain a better understanding of market sentiment and adjust their trading strategies accordingly.
Reversal Patterns
Reversal patterns indicate that the prevailing trend may be coming to an end. Common reversal patterns include:
Head and Shoulders: This pattern signals a reversal in the market, where the price forms three peaks: one higher peak (head) between two lower peaks (shoulders).
Double Top and Double Bottom: A double top is a bearish reversal pattern formed after an uptrend, while a double bottom is a bullish reversal pattern formed after a downtrend.
Continuation Patterns
Continuation patterns suggest that the current trend is likely to continue. Some popular continuation patterns include:
Triangles: Triangular formations can be ascending, descending, or symmetrical. These patterns indicate periods of consolidation before the price breaks out in the direction of the prevailing trend.
Flags and Pennants: Flags and pennants are short-term consolidation patterns that occur after a strong price movement. They signal a continuation of the trend once the price breaks out of the pattern.
How to Use Candlestick Charts for Forex Trading
Identifying Market Trends
Candlestick charts are helpful in identifying trends in the forex market. By examining the length and direction of the candlestick bodies and wicks, traders can determine whether the market is trending upward, downward, or consolidating. Traders can then align their trades with the prevailing trend for better chances of success.
For example, a series of bullish candlesticks with long bodies and small wicks could indicate a strong uptrend. Conversely, a series of bearish candlesticks with long bodies may indicate a strong downtrend.
Spotting Support and Resistance Levels
Support and resistance levels are key concepts in forex trading. Candlestick charts can help traders identify these levels, which can act as barriers that price struggles to break through. A candlestick pattern that forms near support or resistance levels can give traders valuable clues about potential price reversals.
For instance, if a bullish candlestick forms near a support level, it suggests that the price may bounce back up. Similarly, a bearish candlestick near a resistance level could signal a potential price reversal downward.
Timing Entries and Exits
Candlestick charts also help traders time their entries and exits. By recognizing candlestick patterns and analyzing their placement within a trend, traders can enter trades at more favorable price levels.
For example, a trader might wait for a bullish engulfing pattern to appear after a downtrend to confirm that the market is reversing. Conversely, a bearish engulfing pattern after an uptrend could signal a good time to enter a short trade.
Risk Management and Candlestick Charts
While candlestick patterns are a valuable tool for predicting price movements, it’s essential to practice proper risk management. Forex trading involves inherent risks, and relying solely on candlestick patterns can lead to losses if the market doesn’t behave as expected.
Traders should always use stop-loss orders, diversify their positions, and maintain proper risk-reward ratios. Additionally, combining candlestick analysis with other technical indicators, such as moving averages or oscillators, can increase the accuracy of predictions.
Conclusion
Reading forex candlestick charts is an essential skill for any trader looking to understand market movements and make informed decisions. By familiarizing yourself with the anatomy of candlesticks, recognizing key patterns, and using proper risk management techniques, you can enhance your ability to predict price movements and improve your trading strategies. While candlestick patterns provide valuable insights, remember that successful forex trading requires a combination of technical analysis, risk management, and emotional discipline.
Related topics:


