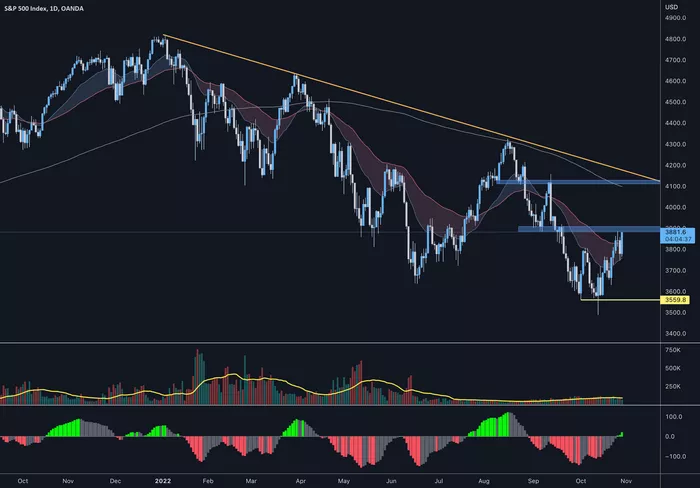
In the world of stock market analysis, technical patterns play a crucial role in predicting future price movements. Among these patterns, the triple top stands out as a significant indicator of potential reversals in an asset’s price trend. This detailed guide will introduce you to the triple top pattern, how it works, and how you can use it to make informed trading decisions.
What Is Triple Top
A triple top is a technical chart pattern used in technical analysis to predict a reversal in the movement of an asset’s price. As the name suggests, the pattern consists of three distinct peaks that form at nearly the same price level. This repetition of peaks creates a visual pattern that signals to traders that the asset may no longer be rallying and that lower prices may be on the horizon.
Understanding the triple top pattern requires a foundational knowledge of technical analysis, chart patterns, and how traders use these tools to make decisions. In this guide, we’ll break down the triple top pattern into simple, easy-to-understand components.
Formation of a Triple Top
The triple top pattern occurs after an uptrend in an asset’s price. The pattern is formed when the price creates three peaks that move into the same price area, with pullbacks or declines in between each peak.
Here’s a step-by-step breakdown of how a triple top forms:
First Peak: The asset’s price reaches a high point, forming the first peak. This peak is a resistance level where sellers outnumber buyers, causing the price to decline.
Pullback: After the first peak, the price pulls back or declines to a lower level. This pullback creates a temporary dip in the price trend.
Second Peak: The price then rallies again, approaching or reaching the same price level as the first peak. This forms the second peak and retests the resistance level.
Second Pullback: The price once again pulls back from the second peak, creating another dip in the price trend.
Third Peak: The price rallies for a third time, forming the third peak. Like the first and second peaks, this peak occurs at nearly the same price level.
Completion of the Pattern: After the third peak, if the price falls below the swing lows (the lows between the peaks), the triple top pattern is considered complete. This indicates a potential further price slide.
Key Characteristics of a Triple Top
To be considered a valid triple top pattern, several key characteristics must be present:
1. Three Peaks at the Same Price Level
The most obvious characteristic of a triple top is the presence of three peaks that form at nearly the same price level. These peaks create a clear resistance area where the price struggles to move higher.
2. Pullbacks Between Peaks
The peaks are separated by pullbacks or declines in the price. These pullbacks create a “sawtooth” pattern on the chart, with each peak followed by a dip.
3. Occurrence After an Uptrend
The triple top pattern must occur after an uptrend in the asset’s price. This means that the price has been moving higher before forming the three peaks.
4. Confirmation with Price Decline
The pattern is considered complete and indicates a potential price slide once the price falls below the swing lows. This confirmation is crucial for traders to make informed decisions.
Trading the Triple Top Pattern
Once the triple top pattern is identified, traders can use it to make informed trading decisions. Here’s how you can trade the triple top pattern:
1. Identify the Pattern
Look for three peaks at nearly the same price level on a chart, with pullbacks in between. Confirm that the pattern occurs after an uptrend.
2. Wait for Confirmation
Wait for the price to fall below the swing lows to confirm the completion of the triple top pattern. This is the signal to take action.
3. Exit Longs or Enter Shorts
Once the pattern is confirmed, traders can exit any long positions they hold in the asset or enter short positions to profit from the potential price decline.
4. Place a Stop Loss
To manage risk, place a stop loss above the resistance area (the peaks) to limit potential losses if the price moves higher unexpectedly.
5. Estimate the Downside Target
The estimated downside target for the pattern is the height of the pattern subtracted from the breakout point. This gives traders an idea of how far the price may fall.
Psychology Behind the Triple Top
The triple top pattern is not just a visual representation of price movements; it also reflects the underlying psychology of the market participants.
Here’s how the psychology of the triple top pattern works:
1. Resistance Area
The area of the peaks represents a resistance area where sellers outnumber buyers. This creates a natural barrier that the price struggles to penetrate.
2. Limited Profit Potential
As the price approaches the resistance area multiple times (forming the three peaks), traders who hold onto the asset may see limited profit potential. This can lead to a lack of buying pressure at those price levels.
3. Selling Pressure
Once the price falls below the swing lows, it puts pressure on traders who bought during the pattern to start selling. This selling pressure can escalate as former buyers exit losing positions and new traders jump into short positions.
4. Fueling the Selloff
The psychology of the pattern helps fuel the selloff after the pattern completes. As the price falls, it triggers a chain reaction of selling that can drive the price lower.
Limitations of the Triple Top Pattern
While the triple top pattern is a useful tool in technical analysis, it’s not perfect. Here are some limitations to consider:
1. False Signals
Sometimes, a triple top pattern will form but fail to confirm with a price decline. This can lead to false signals that can mislead traders.
2. Market Conditions
The triple top pattern may not work in all market conditions. For example, in highly volatile markets, the pattern may be difficult to identify or may not provide reliable signals.
3. Other Factors
Technical patterns should always be considered in conjunction with other factors, such as fundamental analysis, economic indicators, and news events. Relying solely on technical patterns can lead to overly simplistic trading decisions.
Conclusion
The triple top pattern is a valuable tool in technical analysis, providing traders with a clear indication of potential price reversals. By understanding the formation, characteristics, and trading strategies associated with the triple top pattern, traders can make informed decisions and potentially profit from the market’s movements.
Remember, no technical pattern works all the time, and the triple top is no exception. Always consider other factors and use risk management tools like stop losses to protect your investments. With practice and experience, you’ll become more proficient at identifying and trading the triple top pattern.
Related topics:


