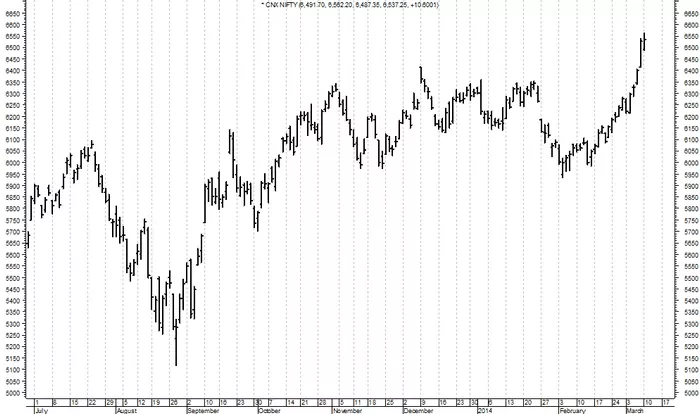
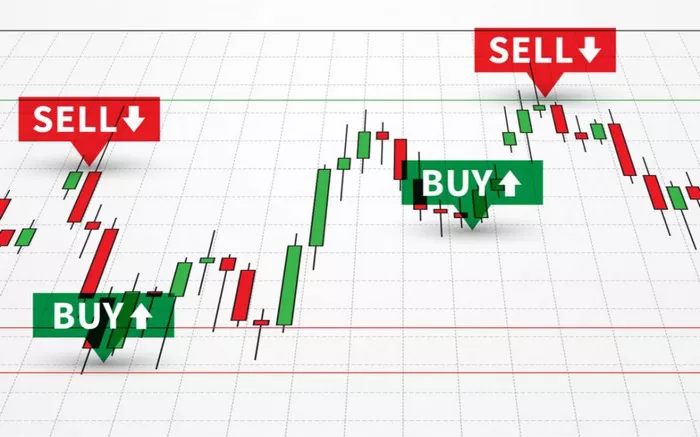
The stock market is a dynamic environment where stock prices constantly rise and fall. For investors and traders, understanding trends is key to making informed decisions. A trend in stocks refers to the general direction in which the price of a particular stock, or the stock market as a whole, is moving over a period of time. Recognizing and understanding trends is crucial because it can help investors predict future price movements, decide when to buy or sell stocks, and manage investment risks effectively.
In this article, we will delve into the concept of stock trends, how they work, different types of trends, and the tools and strategies used to identify and capitalize on trends in the stock market.
Understanding Stock Market Trends
What is a Stock Trend?
A stock trend is essentially the movement of a stock’s price over time, indicating whether the stock is generally moving upwards, downwards, or remaining steady. Trends can be observed over various time frames, from minutes to months, and even years. Trends play a crucial role in technical analysis, which involves analyzing historical price movements to forecast future price action.
There are three main types of trends in the stock market:
Uptrend (Bullish Trend): This occurs when stock prices are consistently rising over a period of time.
Downtrend (Bearish Trend): This occurs when stock prices are consistently falling.
Sideways Trend (Neutral or Consolidation): This occurs when stock prices are moving within a range, neither rising nor falling significantly.
Importance of Trends in Stock Trading
Trends are essential in stock trading because they provide valuable insights into market behavior. Investors use trends to determine the direction of stock prices and make decisions based on this information. For example:
In an uptrend, investors may choose to buy stocks, expecting prices to rise further.
In a downtrend, traders may sell stocks or short sell, anticipating further price declines.
In a sideways trend, traders may adopt a more cautious approach, looking for opportunities within the range.
Identifying trends can significantly increase the chances of making profitable trades while reducing the risk of losses.
Types of Trends in Stocks
1. Uptrend (Bull Market)
An uptrend occurs when the price of a stock is consistently rising. During an uptrend, the general sentiment is positive, and investors are optimistic about the future prospects of the stock. An uptrend is characterized by a series of higher highs and higher lows, meaning each new price peak is higher than the previous one, and each new price dip is higher than the one before it.
Characteristics of an Uptrend:
Higher highs: The price reaches new levels that surpass previous peaks.
Higher lows: The stock’s price never dips below the previous low.
Strong market sentiment: Positive news, earnings reports, or strong fundamentals often drive uptrends.
2. Downtrend (Bear Market)
A downtrend occurs when the price of a stock is consistently falling. In a downtrend, the market sentiment is generally negative, and investors may become pessimistic about the future performance of the stock. A downtrend is characterized by lower highs and lower lows, meaning the price moves to new lows and continues to drop from previous peaks.
Characteristics of a Downtrend:
Lower highs: The price forms lower peaks, consistently dropping after each rise.
Lower lows: Each dip reaches a lower level than the previous one.
Negative market sentiment: Bad news, declining earnings, or negative outlooks often cause downtrends.
3. Sideways Trend (Neutral Trend or Consolidation)
A sideways trend, or neutral trend, occurs when the price of a stock moves within a horizontal range without forming significant highs or lows. This type of trend is often referred to as consolidation. During a sideways trend, the market is indecisive, and there is no clear direction. Traders may find it challenging to make decisions, as the stock price doesn’t show a consistent upward or downward movement.
Characteristics of a Sideways Trend:
No clear direction: The stock moves up and down within a defined range.
Support and resistance levels: Prices tend to bounce between certain price points, often creating predictable entry and exit points for traders.
Consolidation phase: Stocks may be preparing for a breakout, either upward or downward, after consolidating for some time.
Identifying Trends in the Stock Market
Recognizing and identifying stock trends early can give investors and traders a competitive advantage. There are various ways to identify trends in the stock market, including using technical analysis, fundamental analysis, and a combination of both.
1. Technical Analysis
Technical analysis involves studying past price movements and volume patterns to identify potential future trends. This analysis uses charts, indicators, and patterns to forecast price movements.
Tools and Indicators for Identifying Trends:
Moving Averages (MA): The most commonly used indicators to smooth out price data over a specified period, making it easier to identify trends. A commonly used moving average is the 50-day MA and the 200-day MA.
- Golden Cross: A bullish signal that occurs when the short-term moving average crosses above a long-term moving average.
- Death Cross: A bearish signal that happens when the short-term moving average crosses below a long-term moving average.
Trendlines: Drawing trendlines on a stock chart helps visualize the direction of price movement. If a stock is in an uptrend, the trendline will be drawn below the price, connecting the lows of the stock. In a downtrend, the trendline will be above the price, connecting the highs.
Relative Strength Index (RSI): This is a momentum oscillator that measures whether a stock is overbought or oversold. An RSI value above 70 typically indicates overbought conditions (potential reversal or downtrend), while an RSI below 30 indicates oversold conditions (potential reversal or uptrend).
Moving Average Convergence Divergence (MACD): The MACD is a trend-following momentum indicator that shows the relationship between two moving averages of a stock’s price. MACD crossovers are signals for entering or exiting trades.
2. Fundamental Analysis
Fundamental analysis involves evaluating a company’s financial health and economic factors that could influence stock price movements. While it is more focused on long-term trends rather than short-term price movements, fundamental analysis can help identify stocks with strong growth potential, which could indicate an uptrend.
Key Factors in Fundamental Analysis:
Earnings Reports: Positive earnings results and future earnings growth can drive an uptrend in stock prices.
Company News: Announcements regarding new products, mergers, or leadership changes can influence trends.
Economic Indicators: Interest rates, inflation, GDP growth, and unemployment rates can have significant effects on the overall stock market and individual stocks.
3. Chart Patterns
Chart patterns are visual representations of price movements that can indicate the future direction of a stock’s price. Some well-known chart patterns used by technical analysts to identify trends include:
Head and Shoulders: This pattern signals a reversal of an uptrend (Head and Shoulders Top) or a downtrend (Inverse Head and Shoulders).
Triangles: Symmetrical, ascending, and descending triangles can indicate continuation or reversal trends, depending on the breakout direction.
Flags and Pennants: These are short-term continuation patterns that indicate the stock price is likely to continue in the same direction after a brief consolidation.
4. Volume Analysis
Volume refers to the number of shares traded in a given time period. Volume plays a key role in confirming trends. A trend with increasing volume typically signals strength, while a trend with decreasing volume may indicate weakening momentum.
How to Use Volume to Confirm Trends:
Rising volume during an uptrend: Indicates strong buying interest and a likely continuation of the uptrend.
Rising volume during a downtrend: Indicates strong selling pressure and a likely continuation of the downtrend.
Declining volume during a trend: Suggests weakening momentum and potential trend reversal or consolidation.
Strategies for Trading Trends
Trend Following Strategy
The trend-following strategy is one of the most popular strategies for capitalizing on stock trends. This strategy involves buying stocks during an uptrend and selling them during a downtrend. The goal is to ride the trend for as long as possible, profiting from sustained price movements.
How to Implement Trend Following:
Identify the Trend: Use technical indicators, such as moving averages, to confirm the current trend.
Enter the Market: Buy when the stock is in an uptrend, and sell when the stock is in a downtrend.
Manage Risk: Use stop-loss orders to protect against unexpected reversals.
Swing Trading
Swing trading focuses on short to medium-term price movements within a trend. Swing traders aim to capture smaller price movements within the broader trend, buying during pullbacks in an uptrend and selling during rallies in a downtrend.
Breakout Strategy
A breakout strategy is used to capitalize on stocks that break through key support or resistance levels, signaling the start of a new trend. Breakouts are often accompanied by a significant increase in volume, confirming the trend’s strength.
Conclusion
Understanding trends in stocks is crucial for successful trading and investing. Whether you’re an active trader or a long-term investor, recognizing and analyzing trends can help you make more informed decisions. By using tools like technical analysis, chart patterns, and fundamental analysis, you can identify trends early and take advantage of favorable market conditions.
Remember, trends in stocks are not always linear. Markets can experience volatility, and trends can reverse unexpectedly. Therefore, it’s essential to stay informed, continuously monitor the market, and use risk management strategies to protect your investments.
Ultimately, trends in the stock market provide valuable insights into the general direction of prices, helping traders and investors make informed decisions and increase their chances of success.
Related topics:


