Understanding the performance of the U.S. stock market requires familiarity with several key indices that collectively offer a comprehensive view of the market’s health. These indices track various segments of the market, providing insights into the overall economic conditions and investor sentiment. Here are 6 of the broadest measures of U.S. stock market performance.
1. The S&P 500
Overview
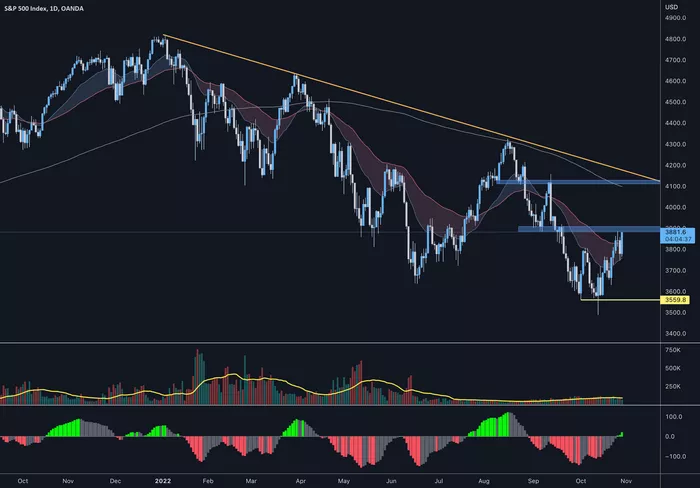
The Standard & Poor’s 500 Index, commonly known as the S&P 500, is one of the most recognized and widely followed stock market indices in the world. It includes 500 of the largest companies listed on U.S. stock exchanges, representing about 80% of the total U.S. stock market capitalization.
Components
The S&P 500 comprises companies from diverse industries, including technology, healthcare, financials, consumer goods, and energy. The index is weighted by market capitalization, meaning larger companies have a greater impact on its performance.
Significance
The S&P 500 is often considered a benchmark for the overall U.S. stock market. Its performance is seen as an indicator of the health of the U.S. economy. Investors use the S&P 500 as a gauge for broad market exposure, and it is commonly referenced in financial news and analyses.
2. The Dow Jones Industrial Average (DJIA)
Overview
The Dow Jones Industrial Average (DJIA), also known as “The Dow,” is one of the oldest and most well-known stock market indices. It includes 30 large, publicly traded companies in the United States.
Components
The DJIA is price-weighted, meaning that stocks with higher prices have a greater influence on the index’s performance. The 30 companies included in the DJIA are leaders in their respective industries, and the index covers a range of sectors such as industrials, technology, healthcare, and consumer services.
Significance
The DJIA is a popular barometer of the U.S. stock market and the economy. Although it includes only 30 companies, its constituents are significant players in their industries, making it a valuable measure of market trends and investor sentiment.
See Also: 8 Reasons Why Amazon’s Share Price Is Falling
3. The NASDAQ Composite
Overview
The NASDAQ Composite is a market-capitalization-weighted index that includes all the stocks listed on the NASDAQ stock exchange. It is known for its high concentration of technology and biotech companies.
Components
The NASDAQ Composite covers over 3,000 stocks, including major technology firms like Apple, Microsoft, Amazon, and Google. Due to its heavy tech weighting, the NASDAQ Composite is often used as an indicator of the health of the technology sector.
Significance
The NASDAQ Composite is a critical measure for investors interested in technology and growth stocks. Its performance is closely watched, especially during periods of technological innovation and market volatility.
4. The Russell 2000
Overview
The Russell 2000 Index measures the performance of the smallest 2,000 stocks in the Russell 3000 Index, which represents the largest 3,000 U.S. stocks. The Russell 2000 is a key benchmark for small-cap stocks.
Components
The Russell 2000 includes a diverse range of small-cap companies across various sectors. These companies are generally less established and more volatile than the large-cap stocks found in indices like the S&P 500.
Significance
The Russell 2000 is widely used to gauge the performance of small-cap stocks. It provides insights into the health and trends of smaller, often growth-oriented companies, which can be indicators of broader economic changes.
5. The Wilshire 5000 Total Market Index
Overview
The Wilshire 5000 Total Market Index, often referred to as the “total market index,” aims to measure the performance of all U.S. equity securities with readily available price data. It is one of the broadest indices, encompassing a vast array of companies.
Components
The Wilshire 5000 includes over 3,500 stocks, covering large-cap, mid-cap, small-cap, and micro-cap companies. It provides a comprehensive snapshot of the entire U.S. stock market.
Significance
As one of the broadest measures of U.S. stock market performance, the Wilshire 5000 offers investors a detailed view of the market’s overall health. It is particularly useful for those looking to understand the performance of the market as a whole, rather than focusing on specific segments.
6. The MSCI USA Index
Overview
The MSCI USA Index is a free-float-adjusted market-capitalization-weighted index designed to measure the performance of the large and mid-cap segments of the U.S. market. It includes around 600 companies.
Components
The MSCI USA Index covers a broad spectrum of industries and sectors, similar to the S&P 500, but also includes mid-cap companies, providing a slightly wider view of the market.
Significance
The MSCI USA Index is widely used by global investors as a benchmark for U.S. equities. It is part of the MSCI Global Equity Indices, making it a crucial tool for international investors assessing the U.S. market in the context of global investment strategies.
Conclusion
Understanding the broad measures of U.S. stock market performance is essential for investors seeking to navigate the complexities of the market. The S&P 500, DJIA, NASDAQ Composite, Russell 2000, Wilshire 5000, and MSCI USA Index each provide unique insights into different segments and aspects of the market. By analyzing these indices, investors can gain a comprehensive understanding of market trends, sector performances, and economic conditions. These indices collectively help in making informed investment decisions and in assessing the overall health of the U.S. economy.
Related topics: