All major U.S. stock market indices would need to perform strongly at the end of the year to close flat. While it is not impossible for the S&P 500, Nasdaq 100 and Dow Jones, it usually only happens when the market is in an uptrend, not in a down year like now.
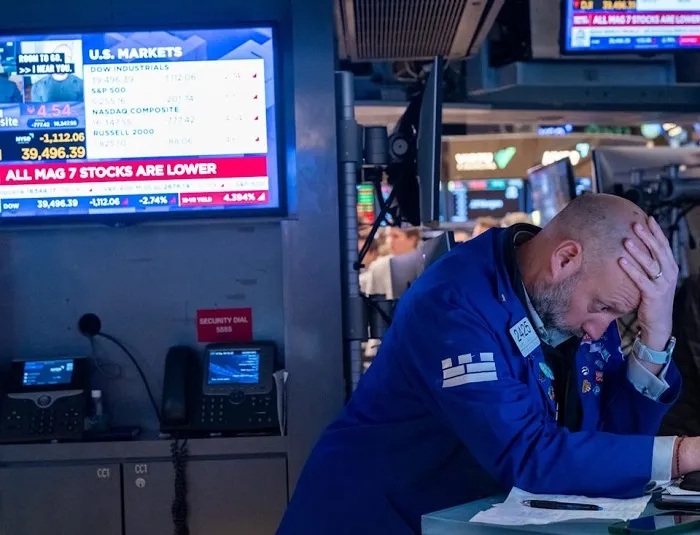
Since President Donald Trump announced his sweeping tariff policy a week ago and triggered global market turmoil, the U.S. stock market has lost trillions of dollars. All major indices, including the S&P 500, Nasdaq 100 and Dow Jones Industrial Average, are down for the year as the market reacted extremely negatively to Trump’s new trade policy.
The massive sell-off triggered by Trump’s new policy has reversed what was expected to be another good year for the market. Investors and analysts had expected that the U.S. stock market would continue to deliver solid returns even if the gains slowed from the record gains of the previous two years. In fact, Trump’s election brought a new round of market optimism, and the stock market initially soared, driven by many people’s view that he is a pro-business president.
Today, the opposite is true. The uncertainty injected into the U.S. economy by Trump’s return to the White House has led to a continued downturn in the market.
To recoup the losses incurred so far this year, the major U.S. indices — the S&P 500, Nasdaq and Dow — would all have to rise to a level that is not unheard of, but that only occurs in boom years.
However, strong growth seems unlikely in 2025. Since the market crash triggered by Trump’s tariff announcement, most major Wall Street banks have revised their annual economic forecasts to reflect the continued economic downturn. Some of them are even predicting a recession as the stock market declines, the bond market plunge and the dollar depreciate simultaneously occur.
As of Friday, the S&P 500 has fallen 8.8% so far this year, in stark contrast to the strong gains in 2023 and 2024, which are the best since 1998.
To reverse the losses and end the year flat, the S&P 500 would need to rise 9.4% from its close on April 11 to December 31. In this scenario, investors would not lose any money, but they would not make a penny either.
It wouldn’t be totally unusual for the S&P 500 to maintain a similar or better growth rate from April 11 through the end of the year. In fact, it’s happened 22 times since the modern version of the index was established in 1957. While that sounds like good news, investors shouldn’t get too excited. According to data provided by wealth management firm AssetMark and calculations by Fortune, the S&P 500 has only risen 9.4% or more from April 11 in bull market years, not in a down market like 2025. The worst year, 2016, had a total annual return of 12%. The best year was 1958, which had an annual return of 43.4%. The average annual return for all 22 years that met that criteria was 27%.
In other words, the S&P 500 has soared when the market is booming from April to December, not when the market is slowly heading toward zero returns.
To be sure, it’s not an isolated case of a market crisis at the beginning of the year ultimately turning into a year of big gains. In 2020, the year of the coronavirus pandemic, the S&P 500 had its best performance ever between April 11 and December, rising 34.6% during that period. That led to a total return of 18.4% for the year. However, those market plunges were caused by different reasons. In 2020, the market was dealing with the spread of a highly contagious disease for which there was no cure, while this time, the market is dealing with the trade policies deliberately implemented by an elected official.
The potential recovery of the Nasdaq and Dow has the same dynamics as the S&P 500. They need to rise at a reasonable pace, but that will only happen when stocks are booming, not when they are trying to recover.
Analysts now expect stock market performance in 2025 to be worse than forecast at the beginning of the year. According to the London Stock Exchange, the median price target for the S&P 500 on Wall Street in December 2024 is 6,625 points. Based on the S&P 500’s opening price on Jan. 2, that implies a 12.9% gain in 2025.
In the past week, several banks have cut their S&P 500 forecasts, well below their median at the start of the year. Bank of Montreal (BMO) cut its slightly bullish 6,700 forecast to 6,100. Goldman Sachs cut its forecast twice this year, first from 6,500 to 6,200 and then again to 5,700. Goldman’s second cut implies a 2.8% loss for the year. UBS and Royal Bank of Canada also expect losses for the year.
So far this year, the Nasdaq 100 has fallen 11.1%. The index is down 180 points from the start of the year, having topped 22,000 in February. The Nasdaq 100 would need to gain 12.9% to end the year back where it was at the beginning of the year. A 12.9% gain from April to December is not uncommon. It has happened 20 times since the Nasdaq 100 was created in 1985, according to data from AssetMark and calculations by Fortune. But again, it only happened in years with good performance. The worst year in the time period we studied was 1992, which gained at least 12.9%, but returned 8.9% annually. The best year was 1999, which returned 102%.
The Dow Jones Industrial Average survived the crash but fell 5.1% in 2025. In order to end the year without a loss, the Dow Jones Industrial Average would need to rise 5.4% over the rest of the year. The Dow’s historical performance may offer a glimmer of hope for investors. Since 1958, the index has risen at least 5.4% between April 11 and December 35 times, with one year not ending in positive territory. In 1984, the Dow rose 7.1% during that period and ended the year down -3.7%. But for the most part, the first 35 years that met our criteria have seen strong gains. The average return for the Dow during those years was 18.6%. The best year was 1975, with a full-year return of 38.2%.
Related topics: