Reading stocks is a fundamental skill for anyone interested in investing or trading in the stock market. Understanding how stocks behave, interpreting stock data, and knowing how to make informed decisions based on stock information can significantly increase your chances of success as an investor. Whether you are a beginner or an experienced trader, knowing how to read and analyze stocks is crucial for making smart investment choices. This article will guide you through the essential concepts and tools needed to read stocks effectively, offering insights into the different types of stock data, how to interpret stock charts, and strategies for analyzing stocks.
What Does it Mean to Read Stocks?
To “read stocks” means to interpret the information associated with a particular stock in order to understand its price movements, overall performance, and future potential. This involves analyzing stock charts, financial data, and key metrics. It also means understanding how external factors such as economic events, market sentiment, and company fundamentals influence stock prices.
Being able to read stocks effectively allows you to make informed decisions about buying, selling, or holding stocks. This can help you minimize risk, take advantage of price movements, and ultimately achieve your financial goals.
Key Concepts in Reading Stocks
Before diving into the details of reading stocks, it’s important to familiarize yourself with the key concepts that influence stock prices. These concepts form the basis of stock market analysis and provide valuable context for interpreting stock data.
1. Stock Price
The stock price represents the current market value of a share of stock. It fluctuates throughout the trading day based on supply and demand for the stock. Factors such as company performance, industry trends, and broader market conditions can affect stock prices.
2. Market Capitalization
Market capitalization (market cap) is the total value of a company’s outstanding shares of stock. It is calculated by multiplying the stock price by the number of shares outstanding. Market cap provides insight into the size of the company and can help categorize it into different types of stocks, such as large-cap, mid-cap, or small-cap stocks.
3. Volume
Volume refers to the number of shares of a stock that are traded during a specific period. High volume indicates strong investor interest and activity, while low volume can signal a lack of interest or volatility. Analyzing volume can help you understand the strength behind price movements.
4. Earnings Per Share (EPS)
Earnings per share is a key financial metric that indicates how much profit a company is generating for each share of stock. A higher EPS generally suggests a more profitable company. Investors often look at EPS in relation to the stock price to assess whether the stock is overvalued or undervalued.
5. Price-to-Earnings (P/E) Ratio
The P/E ratio is a valuation metric that compares the price of a stock to its earnings per share. A high P/E ratio may indicate that a stock is overvalued, while a low P/E ratio may suggest it is undervalued. The P/E ratio is often used to assess whether a stock is a good investment relative to its earnings potential.
6. Dividends
Dividends are regular payments made by companies to their shareholders from profits. Dividend-paying stocks are often considered more stable, providing consistent returns to investors. Reading the dividend yield (the annual dividend payment divided by the stock price) helps investors evaluate the income-generating potential of a stock.
7. Beta
Beta measures a stock’s volatility in relation to the overall market. A stock with a beta greater than 1 is more volatile than the market, while a beta less than 1 indicates less volatility. Understanding a stock’s beta can help you assess the level of risk associated with investing in that stock.
How to Read Stock Quotes
When you look up a stock quote, you’ll see a variety of information. Understanding how to interpret these quotes is essential for reading stocks. Here are the common elements of a stock quote:
1. Ticker Symbol
The ticker symbol is a unique identifier for a particular stock. It consists of letters and sometimes numbers that represent the company on the stock exchange. For example, Apple’s ticker symbol is AAPL, and Tesla’s is TSLA. The ticker symbol is used to search for stock information quickly.
2. Stock Price
The stock price displayed in a quote is the most recent price at which the stock was traded. It can change frequently during the trading day as buyers and sellers interact in the market.
3. Change in Price
This shows the difference between the current stock price and the previous day’s closing price. It can be expressed as a dollar amount or a percentage. A positive change indicates that the stock price has increased, while a negative change indicates a decline.
4. Volume
Volume is the number of shares traded during a given period, usually in one day. High volume typically suggests strong interest in the stock, while low volume may indicate less trading activity or less investor interest.
5. Day’s Range
The day’s range shows the highest and lowest prices that a stock has traded at during the current trading day. This can give you an idea of the stock’s volatility on that day and help you identify potential price fluctuations.
6. 52-Week Range
The 52-week range shows the highest and lowest prices the stock has traded at over the past year. This provides a broader view of the stock’s performance and helps you assess its long-term volatility.
7. Market Capitalization
Market capitalization is typically displayed in stock quotes as a figure representing the total value of all outstanding shares. It’s useful for determining the relative size of a company in comparison to others in the same industry.
8. P/E Ratio
The P/E ratio is often included in a stock quote. It helps you assess whether a stock is overvalued or undervalued based on its earnings potential. A higher P/E ratio indicates that the stock is more expensive relative to its earnings.
9. Dividend Yield
For dividend-paying stocks, the dividend yield is an important figure. It tells you how much you can expect to earn from dividends relative to the stock’s price. A higher dividend yield can be attractive for income-seeking investors.
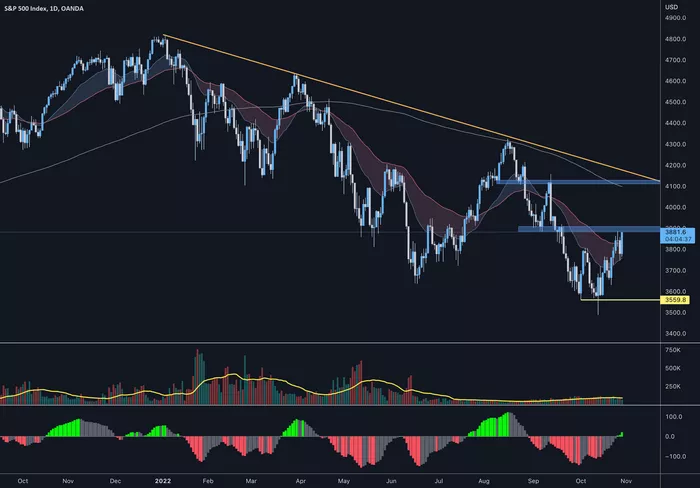
How to Read Stock Charts
Stock charts are a vital tool for visualizing the price movement of a stock over time. They provide insights into the stock’s trends and help investors make decisions based on technical analysis. Here’s an overview of the key components of a stock chart.
1. Price Axis
The price axis is usually on the vertical side of the chart and shows the stock price. The range of prices typically covers the lowest and highest points for the selected time period.
2. Time Axis
The time axis is typically on the horizontal side of the chart. It represents the period over which the stock’s price movements are being observed. The time period can vary from minutes or hours for day traders, to months or years for long-term investors.
3. Candlestick Chart
One of the most common ways to display stock price movements is through a candlestick chart. Each candlestick represents the stock’s price movement during a specific time period. The candlestick has a “body” (the difference between the opening and closing prices) and “wicks” (the highest and lowest prices during the period). The color of the candlestick can indicate whether the stock closed higher or lower than it opened.
Green Candlesticks: Represent a price increase (close higher than open).
Red Candlesticks: Represent a price decrease (close lower than open).
4. Moving Averages
Moving averages are used to smooth out price data to identify trends. They show the average price over a specific number of periods (e.g., 50-day or 200-day moving average). Moving averages help investors understand the general direction of a stock and can act as support or resistance levels.
5. Support and Resistance
Support is the price level at which a stock tends to stop falling, while resistance is the price level at which a stock tends to stop rising. These levels are useful for determining entry and exit points when trading stocks.
6. Volume
Volume is often displayed at the bottom of stock charts. It shows the number of shares traded during a specific time period. Volume spikes can indicate significant interest in a stock and are often seen in conjunction with major price moves.
Types of Stock Analysis
There are two primary approaches for reading and analyzing stocks: fundamental analysis and technical analysis. Both methods provide valuable insights and can be used together to make well-rounded investment decisions.
1. Fundamental Analysis
Fundamental analysis focuses on evaluating a company’s financial health and growth potential by analyzing its financial statements, management, industry position, and economic factors. Key metrics include:
- Earnings per share (EPS)
- Price-to-earnings (P/E) ratio
- Revenue growth
- Profit margins
- Debt-to-equity ratio
Fundamental analysis is useful for long-term investors who are looking for companies with strong growth potential and solid financials.
2. Technical Analysis
Technical analysis focuses on analyzing past market data, primarily stock price and volume, to forecast future price movements. This method uses charts and technical indicators such as moving averages, Relative Strength Index (RSI), and Bollinger Bands. Technical analysis is typically used by short-term traders who want to capitalize on price movements within shorter time frames.
Conclusion
Learning how to read stocks is a crucial skill for anyone interested in investing in the stock market. By understanding stock prices, financial metrics, stock quotes, and stock charts, you can make more informed decisions about your investments. Additionally, by applying both fundamental and technical analysis, you can identify stocks with strong growth potential and capitalize on market trends. Whether you are a beginner or an experienced investor, mastering the art of reading stocks will help you make smarter investment decisions and navigate the complexities of the financial markets with confidence.
Related topics: