In the world of stock trading, understanding chart patterns is crucial for making informed decisions. One such pattern that traders often encounter is the “double top.” This article will delve into what a double top means in stocks, how to identify it, and its implications for traders and investors. By the end of this article, you will have a comprehensive understanding of this important technical analysis tool.
Understanding Chart Patterns
The Basics of Technical Analysis
Technical analysis is a method used by traders to evaluate securities and forecast their future movements based on past market data, primarily price and volume. Chart patterns are a key component of technical analysis, providing visual representations of market sentiment and potential price movements.
Importance of Chart Patterns
Chart patterns help traders identify potential entry and exit points, manage risk, and make informed trading decisions. Recognizing these patterns early can provide a significant advantage in the market.
What is a Double Top?
Definition of a Double Top
A double top is a bearish reversal pattern that forms after an extended uptrend. It is characterized by two consecutive peaks at approximately the same price level, separated by a trough. The pattern is complete when the price breaks below the trough, signaling a potential reversal of the prior uptrend.
Visual Representation
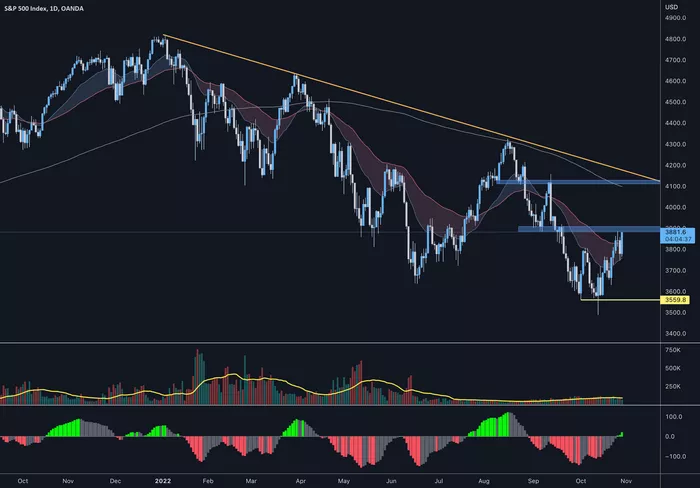
Imagine a stock’s price chart where the price rises to a peak, retraces to a support level, rises again to a similar peak, and then falls below the support level. This formation resembles the letter “M,” hence the double top is sometimes referred to as an “M” pattern.
Identifying a Double Top
Key Characteristics
Two Peaks: The pattern consists of two distinct peaks at roughly the same price level.
Trough: The trough between the two peaks acts as a support level.
Volume: Volume typically decreases during the formation of the second peak, indicating weakening buying pressure.
Breakout: The pattern is confirmed when the price breaks below the support level (the trough).
Time Frame
Double tops can form over various time frames, from intraday charts to weekly or monthly charts. The significance of the pattern often depends on the time frame in which it appears.
Psychological Underpinnings
Market Sentiment
The double top pattern reflects a shift in market sentiment from bullish to bearish. The first peak represents a high point where buyers are in control. The subsequent retracement and second peak indicate that buyers are losing momentum, and sellers are starting to take control.
Resistance and Support
The two peaks act as resistance levels, while the trough serves as a support level. The break below the support level signifies that sellers have overpowered buyers, leading to a potential trend reversal.
Trading the Double Top
Entry Points
Breakout Confirmation: Traders often wait for the price to break below the support level before entering a short position.
Retest: Some traders prefer to enter after a retest of the broken support level, which then acts as resistance.
Stop-Loss and Take-Profit Levels
Stop-Loss: A common stop-loss level is placed just above the second peak to limit potential losses if the price reverses.
Take-Profit: The take-profit level is often set at a distance equal to the height of the pattern, measured from the breakout point.
Risk Management
Proper risk management is crucial when trading double tops. Traders should ensure that their position size aligns with their risk tolerance and that they use stop-loss orders to protect against adverse movements.
Double Top vs. Double Bottom
Comparison
While the double top is a bearish reversal pattern, the double bottom is its bullish counterpart. The double bottom forms after a downtrend and consists of two consecutive troughs at approximately the same price level, separated by a peak. The pattern is complete when the price breaks above the peak, signaling a potential reversal of the prior downtrend.
Key Differences
Trend Direction: Double tops form after uptrends, while double bottoms form after downtrends.
Breakout Direction: Double tops break below support, while double bottoms break above resistance.
Market Sentiment: Double tops indicate a shift from bullish to bearish sentiment, while double bottoms indicate a shift from bearish to bullish sentiment.
Real-World Examples
Historical Double Tops
Apple Inc. (AAPL): In 2012, Apple’s stock formed a double top pattern, leading to a significant decline in price.
Bitcoin (BTC): In 2018, Bitcoin formed a double top pattern, followed by a sharp drop in value.
Analyzing the Patterns
In both examples, the double top pattern provided early warning signs of a potential trend reversal, allowing traders to adjust their positions accordingly.
Limitations and Considerations
False Breakouts
One of the challenges of trading double tops is the possibility of false breakouts. A false breakout occurs when the price briefly breaks below the support level but then reverses, potentially leading to losses for traders who entered short positions.
Volume Confirmation
Volume plays a crucial role in confirming the validity of a double top pattern. A genuine breakout is often accompanied by an increase in volume, while a false breakout may occur on low volume.
Market Context
The effectiveness of the double top pattern can vary depending on the broader market context. Traders should consider other technical indicators and market conditions before making trading decisions based solely on the double top pattern.
Combining with Other Indicators
Moving Averages
Moving averages can help confirm the trend direction and provide additional support or resistance levels. For example, a break below a key moving average can reinforce the bearish signal of a double top.
Relative Strength Index (RSI)
The RSI is a momentum oscillator that measures the speed and change of price movements. An overbought RSI reading during the formation of the second peak can provide additional confirmation of a potential reversal.
Fibonacci Retracement
Fibonacci retracement levels can help identify potential support and resistance levels, providing additional context for the double top pattern.
Advanced Strategies
Inverse Head and Shoulders
The inverse head and shoulders pattern is a more complex reversal pattern that can sometimes be confused with a double top. Understanding the differences between these patterns can help traders make more informed decisions.
Trendlines
Drawing trendlines can help identify the overall trend and provide additional confirmation of a potential reversal. A break below a key trendline can reinforce the bearish signal of a double top.
Multiple Time Frame Analysis
Analyzing the double top pattern across multiple time frames can provide a more comprehensive view of the market and increase the likelihood of successful trades.
Conclusion
The double top pattern is a powerful tool in a trader’s arsenal, providing valuable insights into potential trend reversals. By understanding the key characteristics, psychological underpinnings, and trading strategies associated with this pattern, traders can enhance their ability to make informed decisions and manage risk effectively. However, it is essential to consider the broader market context and use additional technical indicators to confirm the validity of the pattern. With proper knowledge and practice, the double top pattern can be a valuable asset in achieving trading success.
Related topics: