Predicting stock prices is both an art and a science. Although no one can guarantee the future of any stock, investors can increase their chances of success by understanding the various methods and strategies available. This article will explore several key approaches to predicting stocks, including technical analysis, fundamental analysis, sentiment analysis, and other advanced techniques. Whether you are a beginner or an experienced investor, this guide will provide valuable insights to help you make more informed decisions in the stock market.
Understanding the Basics of Stock Prediction
Before diving into the techniques of predicting stock movements, it’s crucial to understand some fundamental concepts in the world of stock trading. Predicting stocks involves analyzing the potential future price movements of shares based on historical data, market trends, and various other factors.
Why Predict Stock Prices?
While it’s impossible to predict stock prices with absolute certainty, understanding how to forecast price movements can provide an investor with a strategic advantage. Accurate predictions allow investors to buy stocks at a low price and sell them when they are high, thereby maximizing returns.
Types of Stock Prediction
There are three primary types of stock prediction:
Technical Analysis: This approach uses historical price movements and trading volume data to forecast future price movements.
Fundamental Analysis: This method evaluates a company’s financial health and broader economic indicators to estimate the stock’s intrinsic value.
Sentiment Analysis: This analysis examines market sentiment, often through news, social media, and investor sentiment to gauge stock movements.
Technical Analysis: Using Historical Data to Predict Stock Trends
What is Technical Analysis?
Technical analysis is the study of past market data, primarily price and volume, to forecast future price movements. It operates on the premise that all information about a stock is already reflected in its price. Therefore, by analyzing past price movements, trends, and patterns, traders can make predictions about where a stock’s price is headed.
Key Tools in Technical Analysis
1. Price Charts
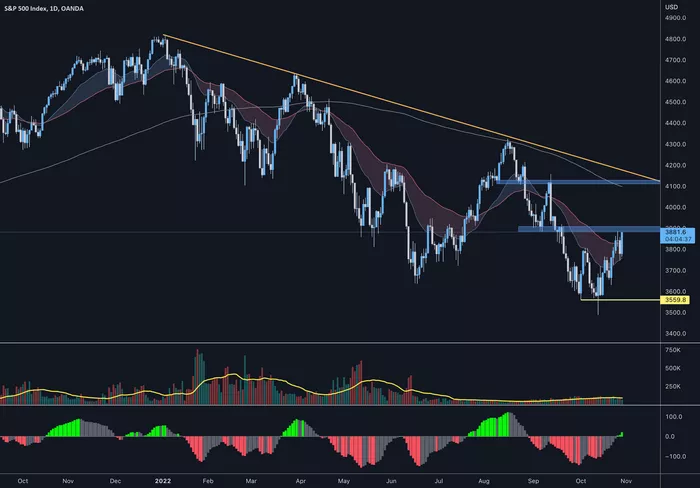
Price charts are the most commonly used tool in technical analysis. They display historical price movements over a specific period. The most widely used chart types include:
Line Chart: A basic chart that connects closing prices over time.
Bar Chart: A chart that shows the open, high, low, and close prices for a given time period.
Candlestick Chart: A more advanced chart that provides a visual representation of price movements and market sentiment within a time period.
2. Support and Resistance Levels
Support: This is the price level at which a stock tends to find buying interest, preventing it from falling further.
Resistance: This is the price level at which a stock tends to face selling pressure, preventing it from rising further.
Understanding support and resistance levels is critical in technical analysis as they can indicate potential turning points in the market.
3. Moving Averages
Moving averages are used to smooth out price data to identify trends over a specific period. The two most common types are:
Simple Moving Average (SMA): The average price over a given time period.
Exponential Moving Average (EMA): Similar to SMA but gives more weight to recent prices, making it more responsive to current market conditions.
Traders use moving averages to determine the direction of the trend and potential reversal points.
4. Indicators and Oscillators
Several technical indicators can help predict stock movements, such as:
Relative Strength Index (RSI): This measures the magnitude of recent price changes to evaluate overbought or oversold conditions.
Moving Average Convergence Divergence (MACD): A momentum indicator that shows the relationship between two moving averages of a stock’s price.
Bollinger Bands: A volatility indicator that uses a moving average and two standard deviations to create bands above and below the price, helping predict potential price breakouts or reversals.
Chart Patterns
Chart patterns help identify trends and predict stock movements based on historical patterns. Some of the most important chart patterns include:
Head and Shoulders: A reversal pattern indicating a potential price trend reversal.
Double Top and Double Bottom: Patterns that signal the end of a prevailing trend.
Triangles: Symmetrical, ascending, and descending triangles that indicate consolidation and potential breakouts.
Fundamental Analysis: Analyzing a Company’s Financial Health
What is Fundamental Analysis?
Fundamental analysis involves evaluating a company’s financial health and market position to estimate its intrinsic value. Unlike technical analysis, which focuses solely on price movements, fundamental analysis seeks to understand the underlying factors that drive stock prices, such as earnings, revenue, and market conditions.
Key Components of Fundamental Analysis
1. Earnings Reports
Earnings reports are released by companies every quarter, providing information on a company’s profitability. Key metrics to look for include:
Earnings Per Share (EPS): A measure of a company’s profitability.
Revenue Growth: A look at how the company’s sales are growing over time.
Net Income: The company’s total earnings after expenses.
2. Financial Ratios
Financial ratios are essential for understanding a company’s financial health. Common ratios include:
Price-to-Earnings (P/E) Ratio: This ratio helps investors assess if a stock is overvalued or undervalued.
Price-to-Book (P/B) Ratio: Compares a company’s market value to its book value.
Debt-to-Equity (D/E) Ratio: Indicates how much debt a company has in relation to its equity.
3. Market Conditions
Market conditions such as economic indicators, interest rates, and geopolitical events can have a significant impact on stock prices. Monitoring macroeconomic indicators like inflation rates, GDP growth, and unemployment levels helps predict the broader market trends that could influence individual stocks.
4. Industry Analysis
Stock prices do not move in isolation. Understanding the performance of the broader industry or sector a company operates in is vital. For example, if the technology sector is thriving, stocks within that sector are more likely to perform well.
Sentiment Analysis: Gauging Market Sentiment
What is Sentiment Analysis?
Sentiment analysis refers to the process of analyzing news, social media, and market sentiment to predict stock movements. In the age of information, market sentiment plays a significant role in influencing stock prices.
Tools for Sentiment Analysis
1. News and Media
Media coverage can have an immediate impact on stock prices. Positive news, such as product launches or favorable earnings reports, can drive stock prices higher, while negative news like scandals or poor earnings can have the opposite effect.
2. Social Media
Platforms like Twitter, Reddit, and StockTwits have become influential in shaping investor sentiment. Monitoring online discussions and social media posts can provide insights into what retail investors are thinking about a particular stock.
3. Market Sentiment Indicators
Several tools can help gauge market sentiment, including:
Put/Call Ratio: This ratio compares the number of put options (bets the market will go down) to call options (bets the market will go up). A high ratio can indicate bearish sentiment, while a low ratio can suggest bullish sentiment.
Volatility Index (VIX): Known as the “fear gauge,” the VIX measures market volatility and investor fear, which can indicate future market movements.
Using Artificial Intelligence and Machine Learning in Stock Prediction
The Role of AI in Stock Prediction
Advancements in artificial intelligence (AI) and machine learning (ML) have revolutionized the way investors predict stock prices. These technologies analyze vast amounts of data in real-time, making them useful for forecasting stock price movements more accurately than traditional methods.
AI models use algorithms to detect patterns and trends that may not be immediately obvious to human analysts. Some of the ways AI is used in stock prediction include:
Algorithmic Trading: Algorithms that automatically execute buy and sell orders based on preset criteria.
Sentiment Analysis: AI tools that analyze social media, news, and financial reports to gauge market sentiment.
Risk Management in Stock Prediction
While predicting stock prices can provide opportunities for profit, it also involves risk. Predicting stocks is not an exact science, and no method guarantees success. Therefore, managing risk is an essential aspect of any stock prediction strategy.
Key Risk Management Strategies
1. Diversification
By investing in a variety of stocks across different industries and sectors, you reduce the impact of poor-performing stocks on your overall portfolio.
2. Setting Stop-Loss Orders
A stop-loss order automatically sells a stock when its price drops to a certain level, helping limit potential losses.
3. Position Sizing
Position sizing refers to the amount of capital allocated to each trade. By carefully managing your position sizes, you can control your exposure to risk.
Conclusion
Predicting stock prices is a complex and nuanced process that requires a combination of technical analysis, fundamental analysis, sentiment analysis, and advanced tools like artificial intelligence. While no method can provide guaranteed results, understanding and applying these techniques can increase your ability to make informed decisions and improve your chances of success in the stock market.
Incorporating these strategies into your trading plan, while always managing risk, is the key to navigating the unpredictable world of stock trading.
Related topics:

